Explanation about Seasonality
Why do stock indices rise at the turn of the year, while falling in August and September? Isn’t that just coincidence? – Questions such as this arise whenever seasonality is studied for the first time. Because only if the stock market’s past movements was seasonally based and not coincidental, can seasonality then be considered a useable forecasting instrument.
In fact there are reasons behind seasonal trends. Stock funds try to improve year-end results by pushing stock prices higher. Other reasons include interest payments in December, because year-end bond coupon payments flow partially into the stock market. The holiday effect (christmas, year-end) also plays a role. Moods are generally positive and many investors use the time-off to make investment decisions. These factors influence the course of prices and lead to seasonal patterns, which investors can utilise.
Each part of the year has a unique reason for its seasonal tendency, for example the rally in autumn or the market strength at the beginning of the year. Additionally every market has its unique reasons for seasonal behaviour. For instance changes in interest rate policy play little role in the agricultural markets whereas harvest time does. But just as we cannot always identify the reasons for a price move, we also cannot always know the actual reasons behind seasonal patterns. The reasons most often attributed to seasonal trends are among others:
- Payments in specific seasons (i.e., at year-end)
- Sentiment at certain times of the year (i.e., holidays)
- Aberrations in financial reporting (i.e., investment funds’ financial statements)
- Harvest time
- Heating season
Seasonal charts show the average course of past years. If there is an extreme move during the year, such as the crash of 1987, then it clearly influences the seasonal chart more than a "normal" year would. In addition there can be similar moves during the same part of the year occurring for a couple of years in a row that have no true seasonal basis. For example company news released coincidentally at the same time of year over a number of years. This can lead to patterns appearing in a seasonal chart that do not have a seasonal nature.
SeasonalCharts.com addresses this problem by using an adequate number of years in the creation of a chart. That increases the probability that patterns appearing in the charts are in fact seasonal. On the other hand years from the distant past whose movements may have little to do with today’s seasonal trends also flow into the calculation. As a compromise we use time periods of between 20 and 30 years.
Seasonality, like any statistical method of analysing the financial markets, is only based on historical data. A seasonal pattern such as the fall rally is ascertained by analysing a large number of years. But not every year is the same. In some years the rally is strongly pronounced, in other years weaker, and in a third year the market falls. Only after analysing a number of years does a seasonal pattern emerge.
But because there are other factors influencing price development such as fundamental, psychological and political factors, the course of individual years is different and sometimes completely contrary to the seasonal trend. Even with a pattern as statistically grounded as the fall rally there are always going to be years that are complete exceptions.
Ultimately, a seasonal pattern is the result of many thousands of individual buy- and sell-decisions. These patterns however can change over time for example because of technical advancements in the agricultural sector. An improvement in storage techniques can change seasonal price development.
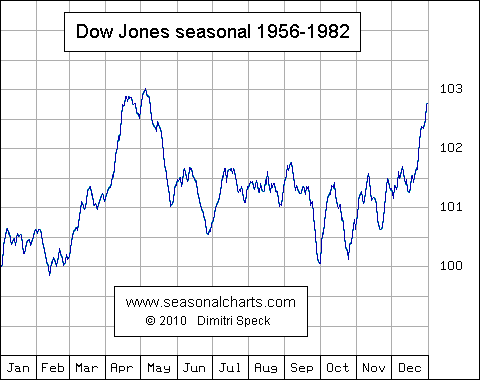
A popular stock market adage is "Sell in May and go away". The seasonal chart of the Dow Jones based on data from 1956 to 1982 shows this seasonal tendency clearly. It’s easy to see why it was advantageous in those years to stay out of the markets during the late spring and summer months.

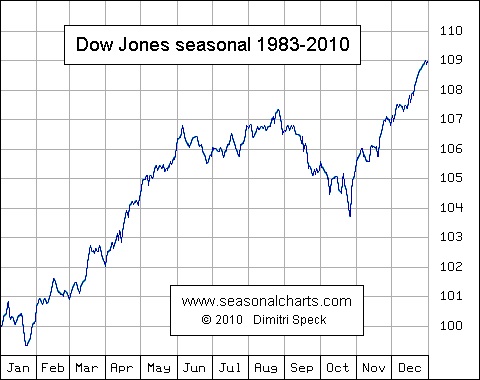
The second chart shows the seasonal course of the Dow Jones since 1983. You can see that during bullish market years the best seasonal selling point would have been in July, two months later than the previous chart indicated. In other words the seasonal trend changed. But based on the year-end rally it also becomes evident that some seasonal patterns survive even the most fundamental changes in the overall market environment. The same is true for the weaknesses in September and October, which even increased (probably because a high need to correct after the strong rallies).

Please read our disclaimer.
For deeper analysis of your own instruments of choice, I recommend Seasonax. It is a product to analyze seasonal trends in stocks, commodities, currencies and indices. Seasonax has been built based on the award-winning algorithms that I developed.
If you are particularly interested in seasonal effects occurring in these financial instruments, you may want to subscribe to my bi-weekly research report “Seasonal Insights”.


